Sucker Rally Or The Return Of The Bulls


Inside This Week’s Bull Bear Report
- Sucker Rally?
- How We Are Trading It
- Research Report –Retail Sales Data Not As Strong As Perceived
- Youtube – Before The Bell
- Market Statistics
- Stock Screens
- Portfolio Trades This Week
Administrative Note: I spent most of this week at an investment banking conference. Therefore, this week’s missive will be a brief market update.
Stock Market Rallies From Oversold Levels
Last week, we noted that a short-term stock rally was likely after the 5.5% selloff from the recent peak. To wit:
“While it took longer than expected, that correction process arrived last week and continued earnestly, with the market falling to the 100-DMA. With the market short-term oversold, a reflexive rally in the next week is likely, with the 50-DMA being notable resistance. Investors should use any market rally toward 5100 to rebalance risk and hedge portfolios.“
On Friday, following blowout earnings from Google and Microsoft, the market challenged the intersection of the 20- and 50-DMA. With the market not overbought yet and the MACD “buy signal” approaching, the bullish case is building. However, the initial resistance of the 50-DMA could prove challenging.
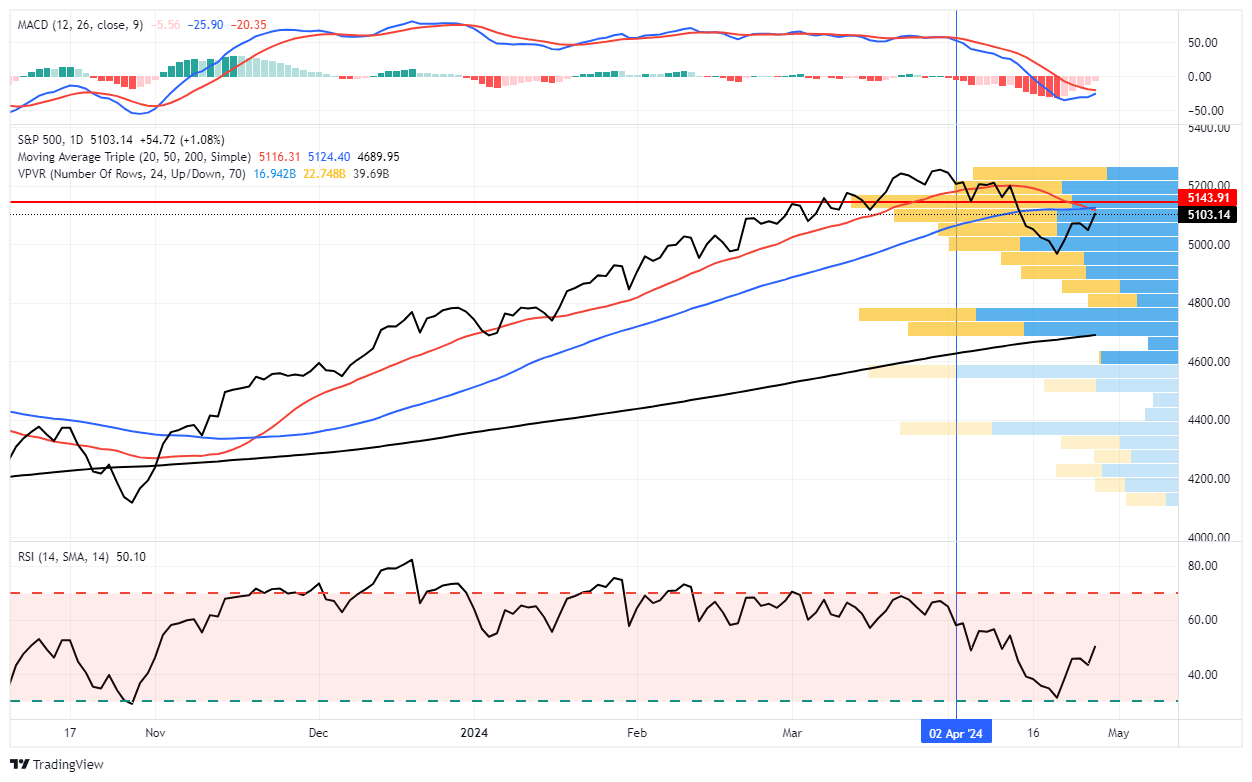
So, is this a “suckers rally” where the market fails and leads to a more significant decline or just a correction that eventually resolves itself to continue the bullish trend that began in November.
That is the topic we will delve into today.
Need Help With Your Investing Strategy?
Are you looking for complete financial, insurance, and estate planning? Need a risk-managed portfolio management strategy to grow and protect your savings? Whatever your needs are, we are here to help.

Sucker Rally Or Return Of The Bulls
As noted above, the 5.5% decline from the recent market peak brought the bears back from hibernation this past week. From the start of “World War 3,” concerns about inflation and Fed policy had investors running for cover. A recent Gallup poll showed the problem:
“The latest index score, from a Jan. 2-22 poll, is up by six points from last month and 14 points since November to -26, the highest since January 2022. The index has been in mostly negative territory since the beginning of the pandemic in 2020. It fell to -58 in June 2022, marking the worst reading since the Great Recession, as inflation reached its highest point in more than 40 years and gas prices set new records. Since then, it has fluctuated, showing modest signs of improvement last summer before worsening again.”
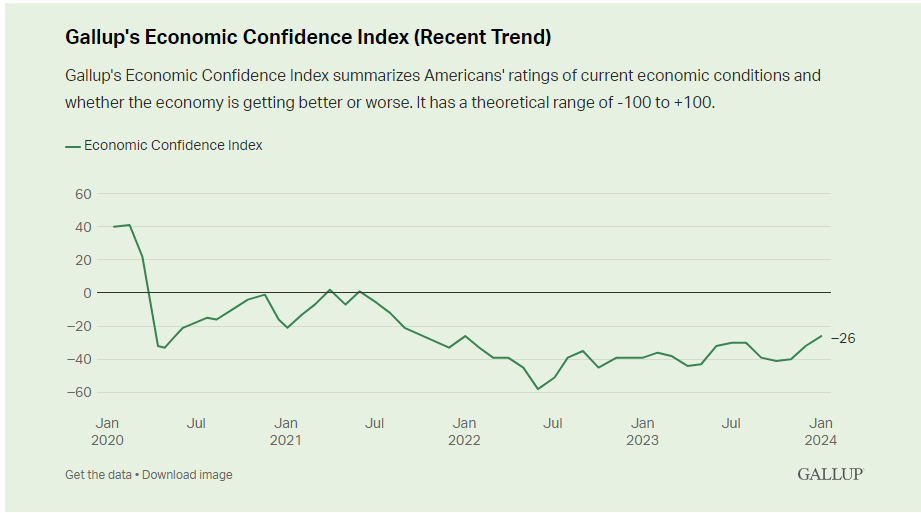
Interestingly, despite the rather gloomy outlook on the economy, they have been exceedingly bullish about the stock market since November. The remaining question was how long before the two views merged.
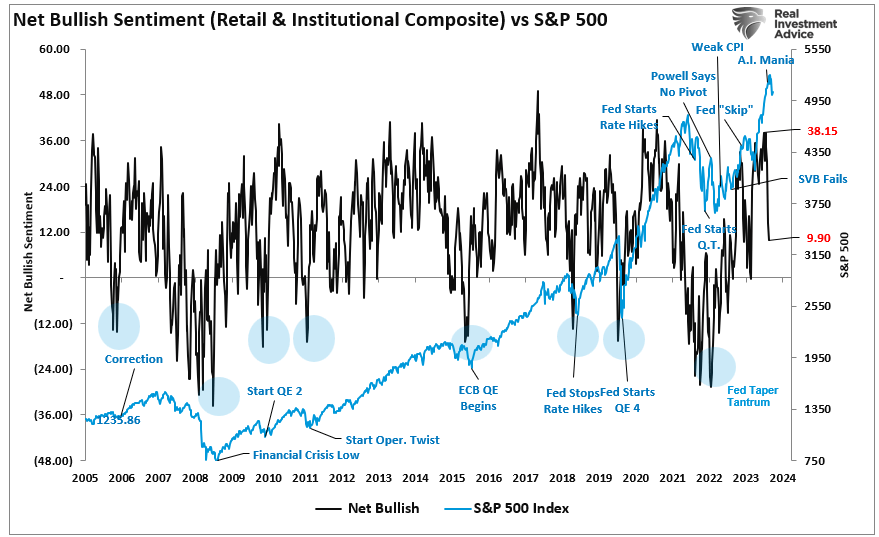
Unsurprisingly, investors quickly reversed their bullish sentiment as stock prices ebbed. The chart below combines retail and professional net bullish sentiment. The net difference between bulls and bears dropped from 38.15 to 9.9 in two weeks. The previous drop between July and October last year was similar and marked the bottom of the correction.
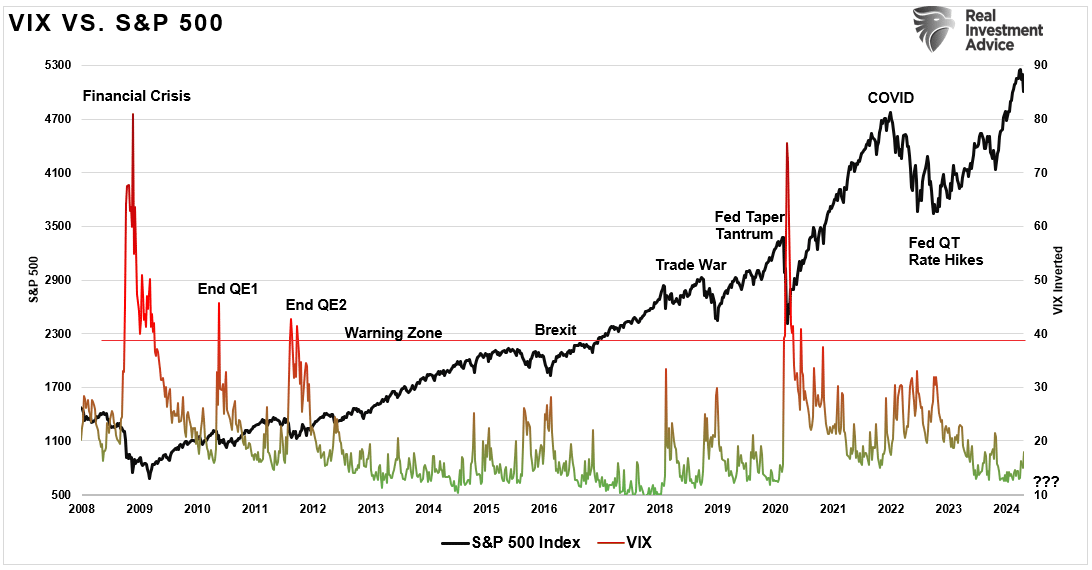
However, as sellers emerged, the market decline remained quite orderly. While the volatility index did increase, it did so modestly, suggesting there was no “panic selling” in the market.
As the market decline broke through the 50-DMA, the bears emerged from hibernation with messages of doom. It was rough, as markets declined for six consecutive days, taking the market darlings down. It seemed as if the bears had regained control of the narrative.
However, with the markets oversold in the short term, we suggested that investors not panic and sell as a “reflexive rally” was likely from these levels. As noted in “Just A Correction:”
“Given the significant reversal in sentiment and short-term oversold conditions, we highly suspect the markets will provide a reflexive rally soon. However, with the number of bullish investors who got “trapped” in the selloff, any rallies will likely be met with further selling.”
But therein lies the risk. Is rally early this week that reflexive rally that leads to a better entry point for investors, or is it a “sucker rally” leading to a more profound decline.
A Liquidity Boost Coming?
One of the factors contributing to the recent selloff, besides just the reversal of ebullient investor sentiment, was a sharp contraction in liquidity. As shown in the Liquidity Index chart below, while liquidity tends to ebb and flow from one week to the next, the trend has supported recent market gains. However, last week, there was a sharp contraction in liquidity coinciding with the contraction in asset prices.
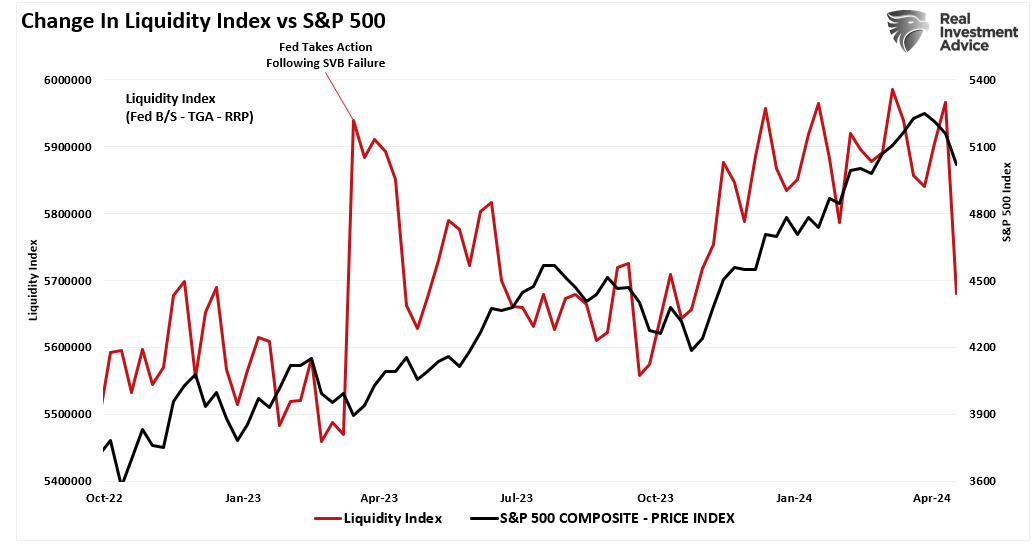
The critical factor in that liquidity change was a sharp increase in the Treasury General Account (TGA). While the Fed’s balance sheet declined from $7.43 trillion to $7.40 trillion, the TGA surged from $675 billion to $930 billion last week. Such was due to the relatively large auctions by the Treasury to fund current expenditures.
As Alfonso Peccatiello recent noted:
“Over the next 6 months, we might experience (another) huge liquidity injection in markets and the economy! How. By having Yellen drain the Treasury General Account (TGA).
You can think of the Treasury General Account (TGA) as the checking account the US Government holds at its bank – which is the Federal Reserve. Every time the US government has accumulated excess money through taxes or bond issuance that it doesn’t intend to immediately channel into spending, they will park it at the TGA account at the Fed.
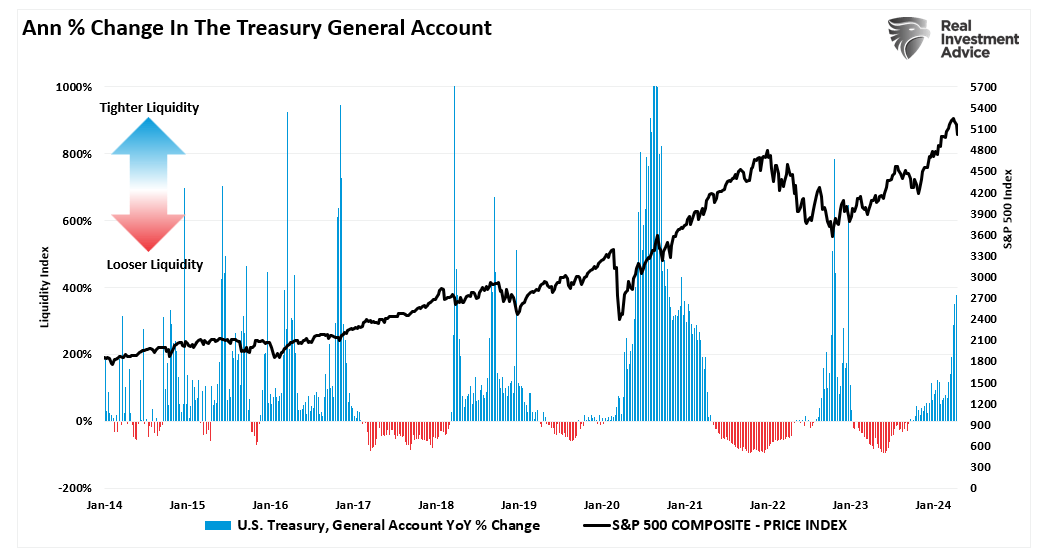
As you can see from the chart above, the TGA generally sits around 250-350 USD billions and it occasionally increases towards USD 1 trillion only to be subsequently drained back to its standard size.
After the ongoing tax season, Yellen will soon have around USD 1 trillion in the TGA – that’s quite high, and hence we should expect a drainage to follow.On top of it, the US debt ceiling suspension only lasts until the end of 2024 and at some point the US will ”run out of room” to issue new bonds which means the only way to facilitate spending will be through using the money sitting in the TGA – great political cover to move ahead with a TGA drainage.
But why does draining the TGA matter that much for markets and the US economy?
That’s because draining the TGA is akin to throwing fresh money at the economy (similar to deficit spending) and also adding new liquidity to the interbank system (similar to QE).”
Of course, as that money finds its way into the economy, it also supports company earnings growth, leading to higher asset prices.
As such, the potential liquidity boost will likely contain the recent correction, keeping it from becoming a “sucker’s rally” to a more considerable decline. At least for the next few months, anyway.
The Return Of Buybacks
The second reason why this is likely not a “sucker’s rally” is that the blackout window for corporate share buybacks is close to ending.
Before the current correction, we wrote:
“As we have discussed for the last month, the market is exceptionally bullish, extended, and deviated from long-term means. With the beginning of the “buyback blackout,” removing an essential buyer of equities is a risk worth watching.” – Buyback Blackout – March 19th
As shown, we are nearing the end of the blackout period, which will begin to reopen in May.
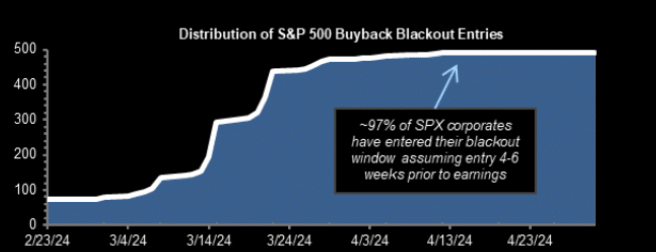
Unsurprisingly, that blackout window coincided with a sharp contraction of more than $367 billion in buybacks over the last 4-weeks.
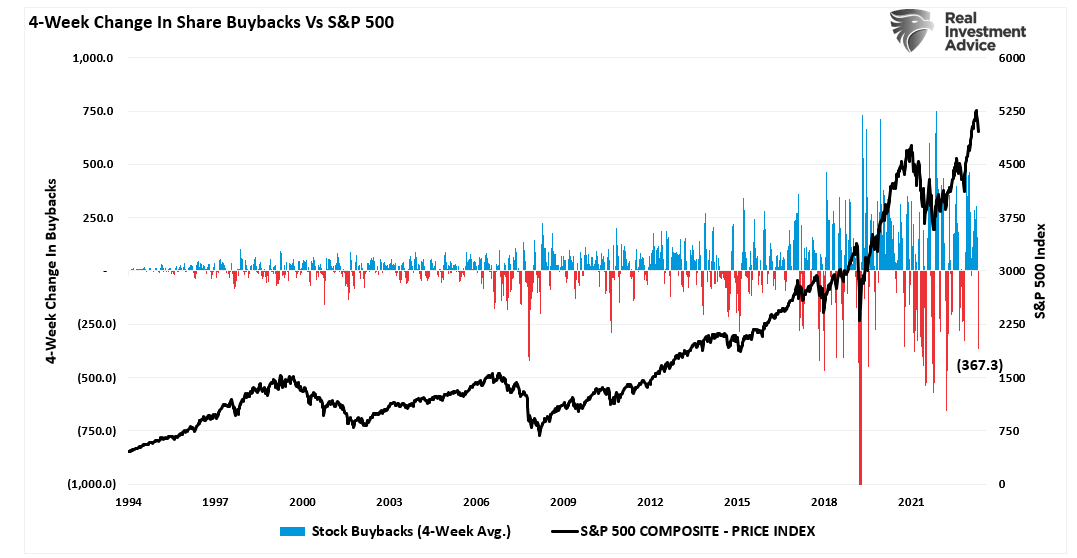
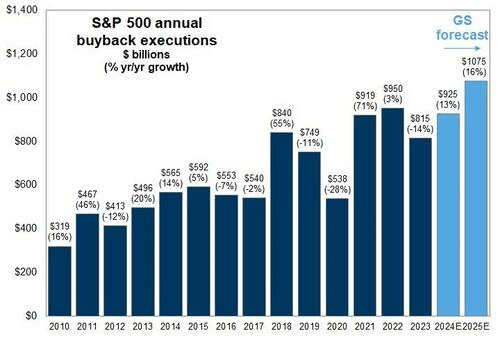
However, corporate share buybacks will resume in the next couple of weeks, and with more than $1 trillion slated for 2024, many buybacks remain to complete. Such is particularly the case with Google adding another $70 billion to that total.
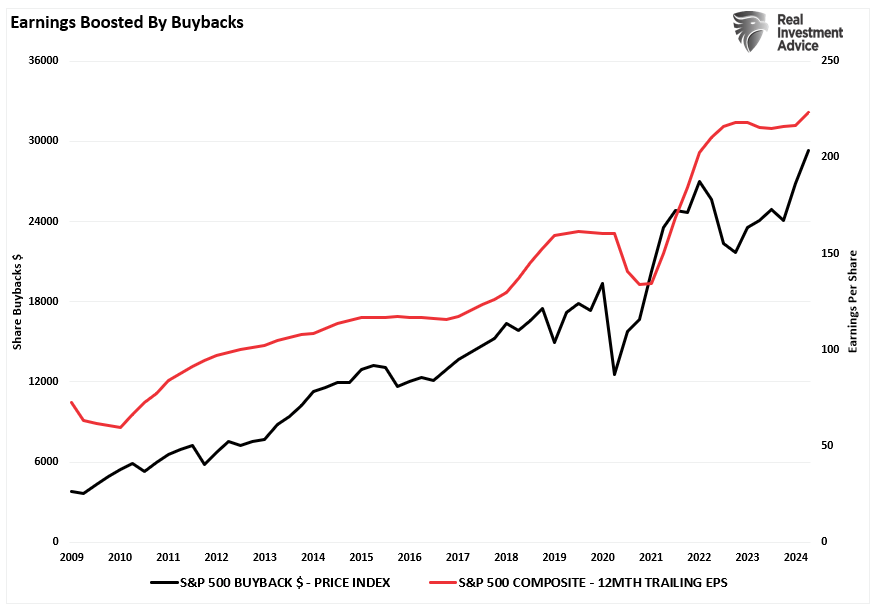
Furthermore, buybacks continue to increase as earnings rise.
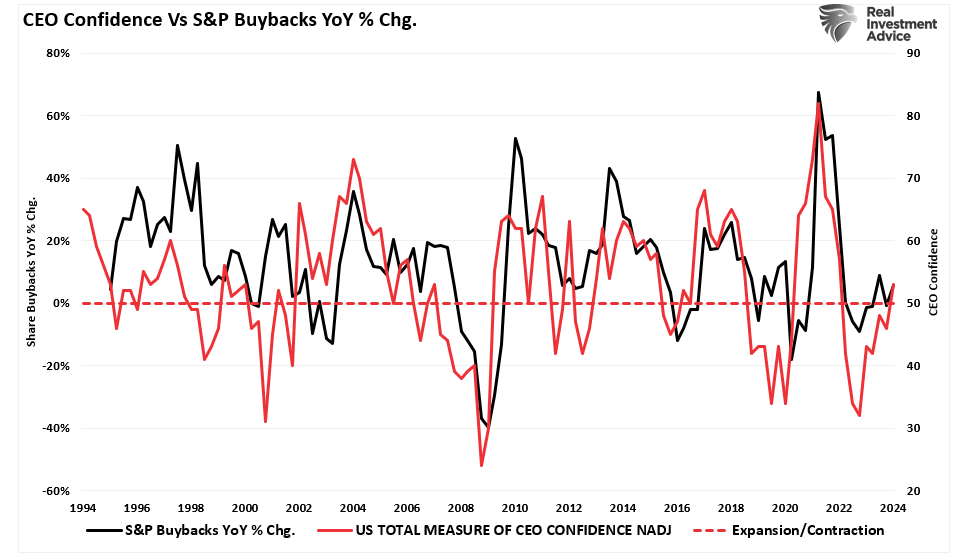
With robust economic activity supporting earnings growth, that improvement boosts CEO confidence. As CEOs are more confident about their business, they accelerate share buybacks to increase executive compensation.
The boost of liquidity from buybacks will likely provide a floor below the market, further limiting the risk of a “sucker’s rally.” Such doesn’t mean the current correction doesn’t have more work to do. However, it is unlikely that it will resolve into something more significant.
At least for now.
But as is always the case, there are possibilities and probabilities. Preparing for an unlikely but always possible event is always a good idea.
How We Are Trading It
This past week, we got a lot of data from GDP to PCE, which provided very different messages to the market. Furthermore, Meta showed little tolerance for disappointment in earnings on Wednesday.
As we stated last week, this remains a normal and healthy correction process and will unlikely devolve into something more egregious. Therefore, it is critical to continue making minor portfolio adjustments and looking for oversold opportunities to add exposures as needed.
A more significant correction will eventually occur, but given the underlying bullish sentiment, it is unlikely now. Things can certainly change; if they do, we will evolve accordingly.
Have a great week.
Research Report

Subscribe To “Before The Bell” For Daily Trading Updates
We have set up a separate channel JUST for our short daily market updates. Please subscribe to THIS CHANNEL to receive daily notifications before the market opens.
Click Here And Then Click The SUBSCRIBE Button
Subscribe To Our YouTube Channel To Get Notified Of All Our Videos
Bull Bear Report Market Statistics & Screens

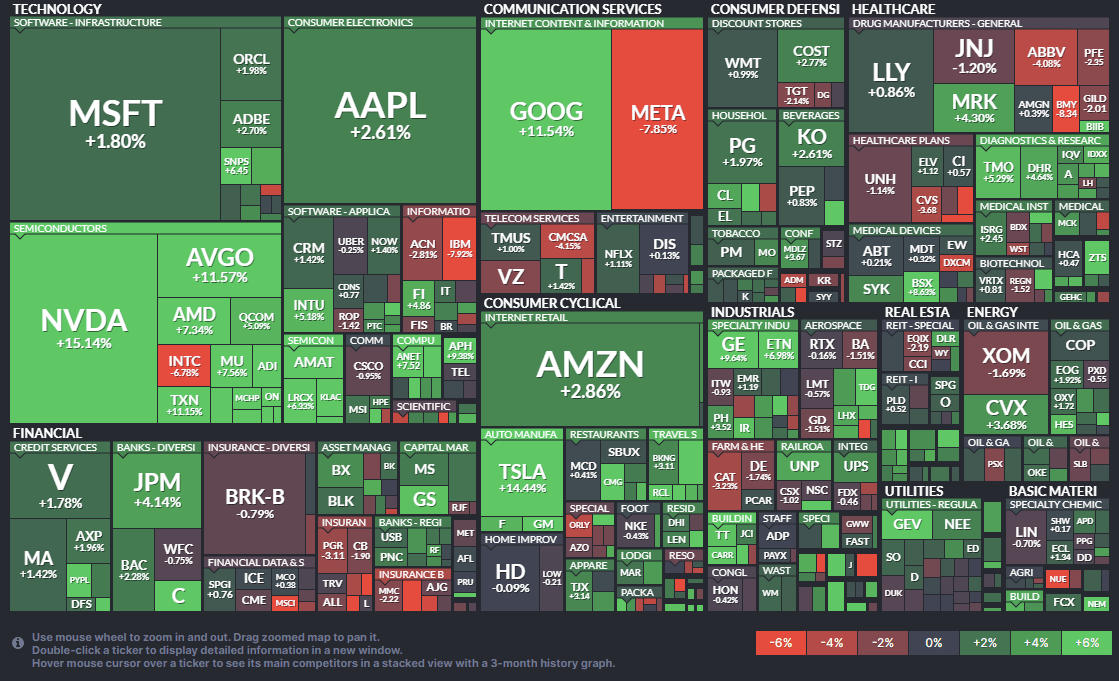
SimpleVisor Top & Bottom Performers By Sector
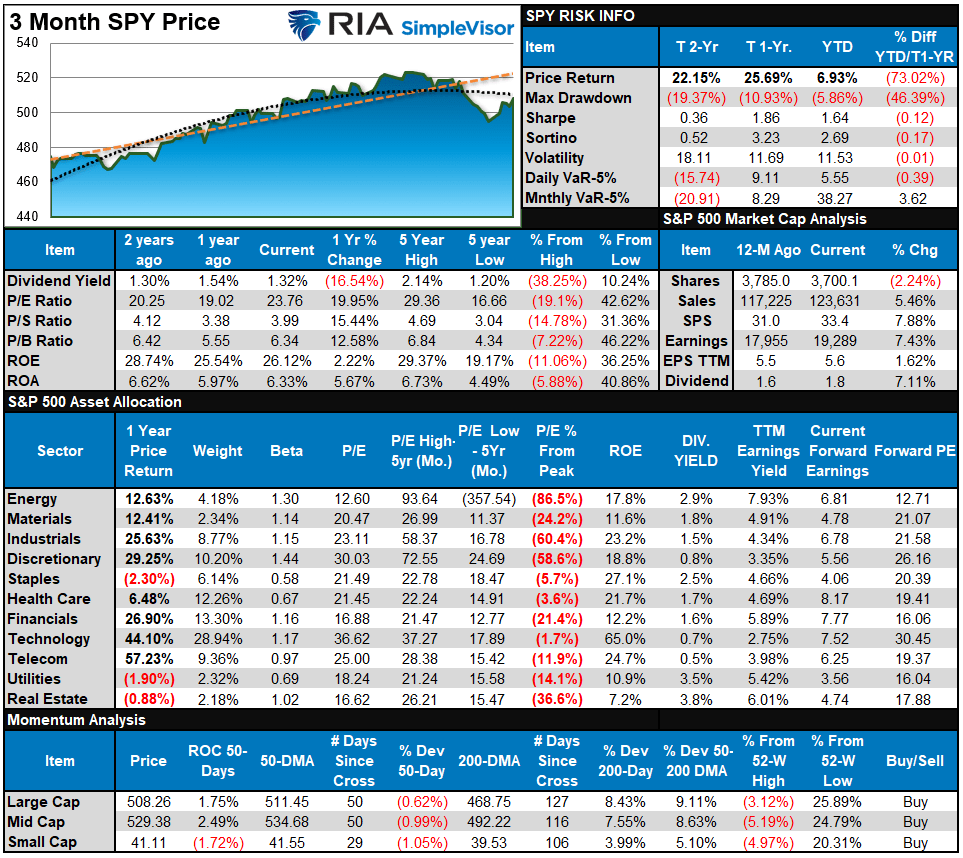
S&P 500 Weekly Tear Sheet
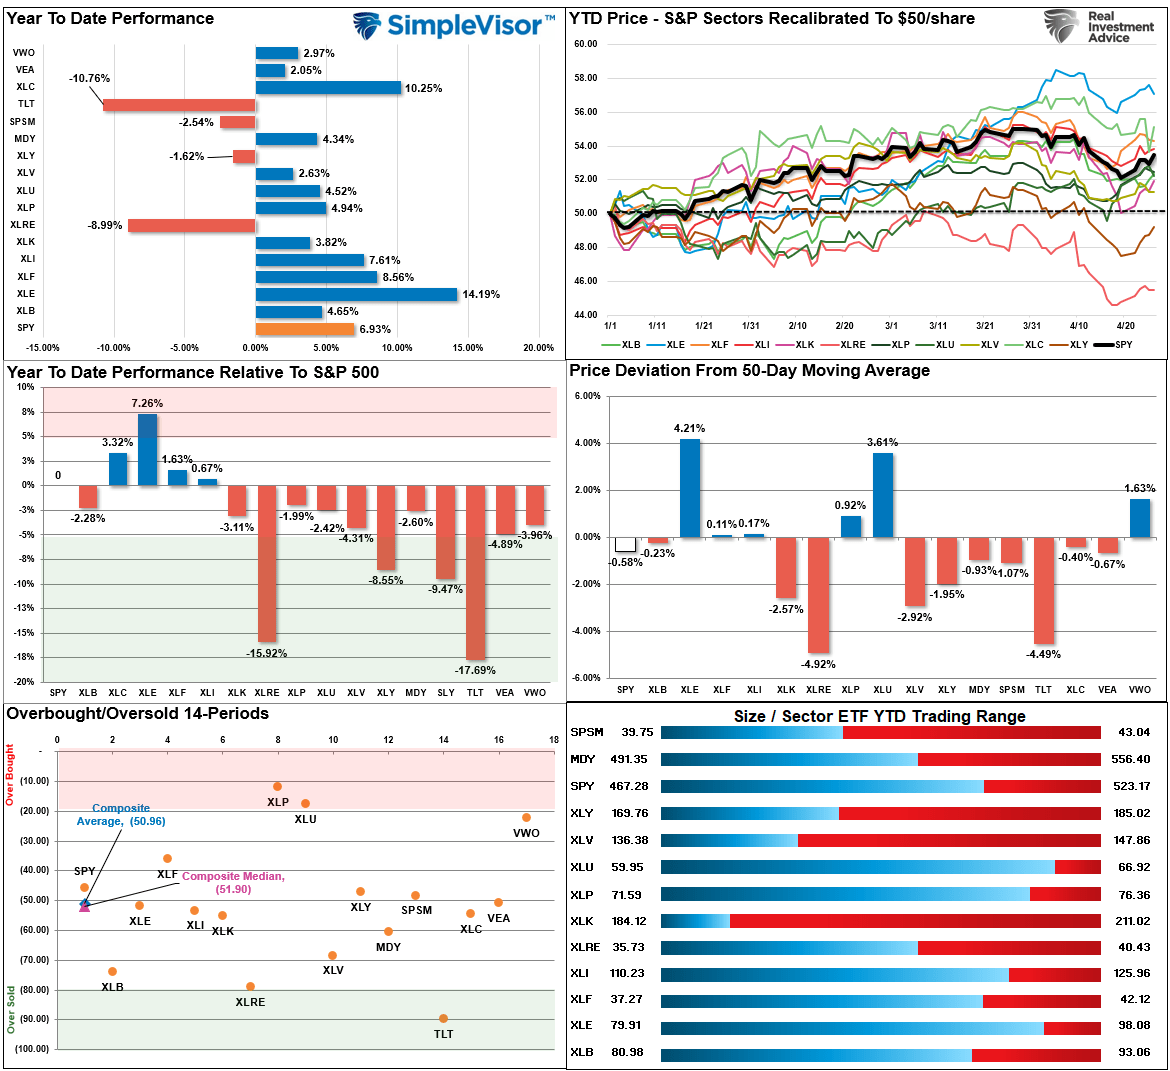
Relative Performance Analysis
Last week, we noted that “most markets and sectors are now oversold, which suggests we could see a bit of buying next week with the market sitting on the 100-DMA.” That rally came this past week with the market recovering to the first resistance level at the 50-DMA. Given the slate of economic data and the Fed meeting, this is a good spot to rebalance risks as needed, as we will likely see some selling pressure next week. The market is NOT overbought yet, which gives it some run to push higher, but the upside is likely limited this week unless the Fed unexpectedly cuts rates.
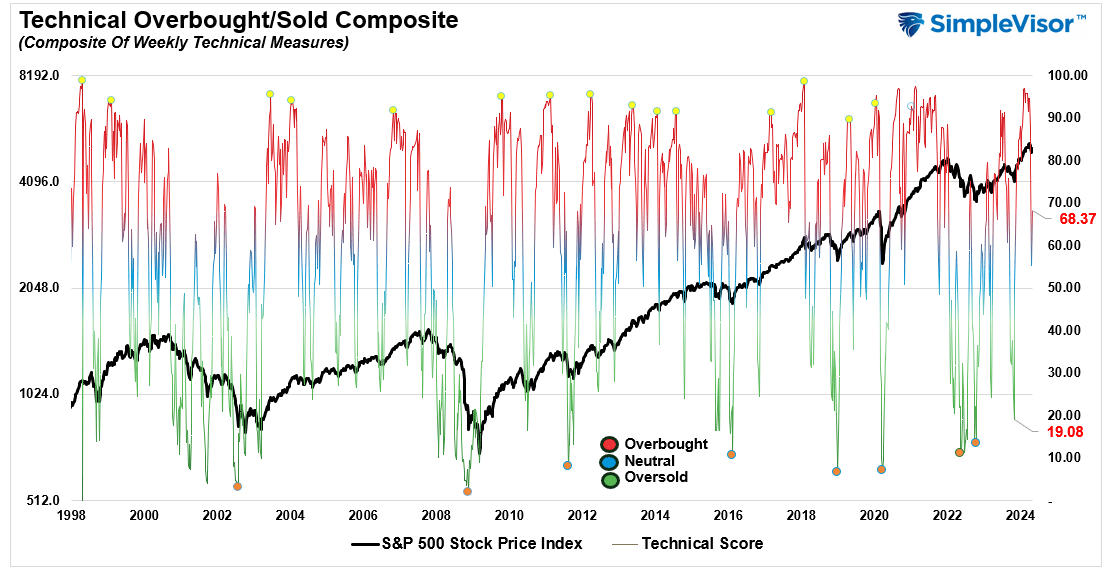
Technical Composite
The technical overbought/sold gauge comprises several price indicators (R.S.I., Williams %R, etc.), measured using “weekly” closing price data. Readings above “80” are considered overbought, and below “20” are oversold. The market peaks when those readings are 80 or above, suggesting prudent profit-taking and risk management. The best buying opportunities exist when those readings are 20 or below.
The current reading is 68.37 out of a possible 100.
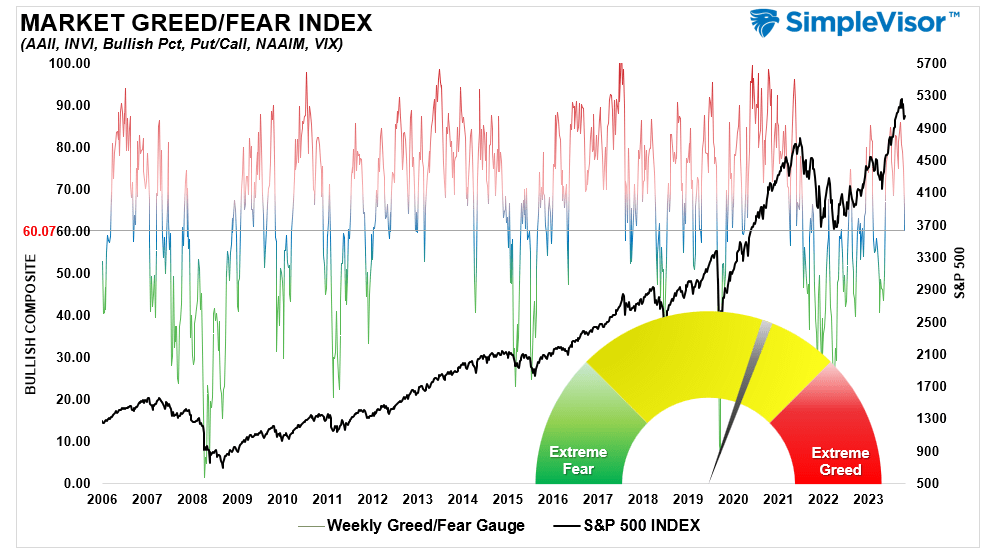
Portfolio Positioning “Fear / Greed” Gauge
The “Fear/Greed” gauge is how individual and professional investors are “positioning” themselves in the market based on their equity exposure. From a contrarian position, the higher the allocation to equities, the more likely the market is closer to a correction than not. The gauge uses weekly closing data.
NOTE: The Fear/Greed Index measures risk from 0 to 100. It is a rarity that it reaches levels above 90. The current reading is 68.15 out of a possible 100.
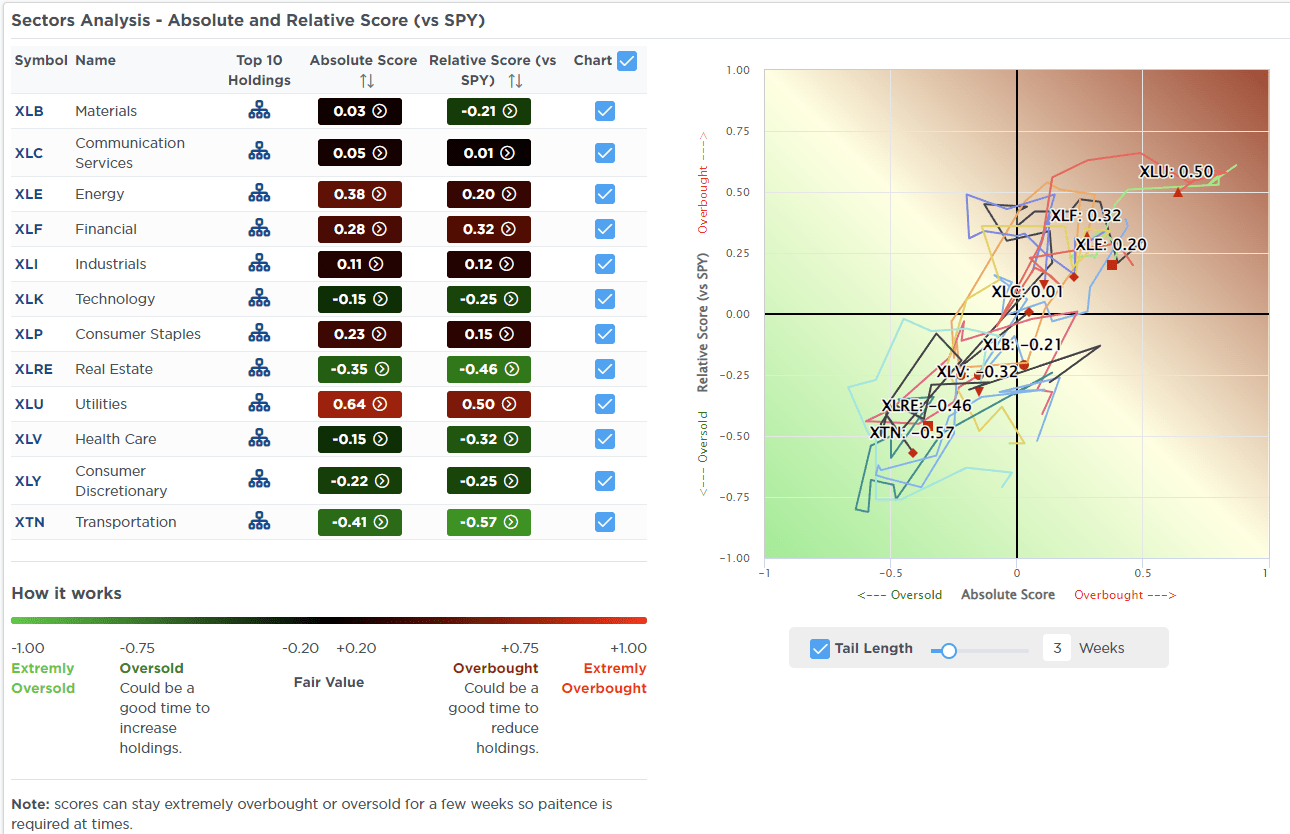
Relative Sector Analysis
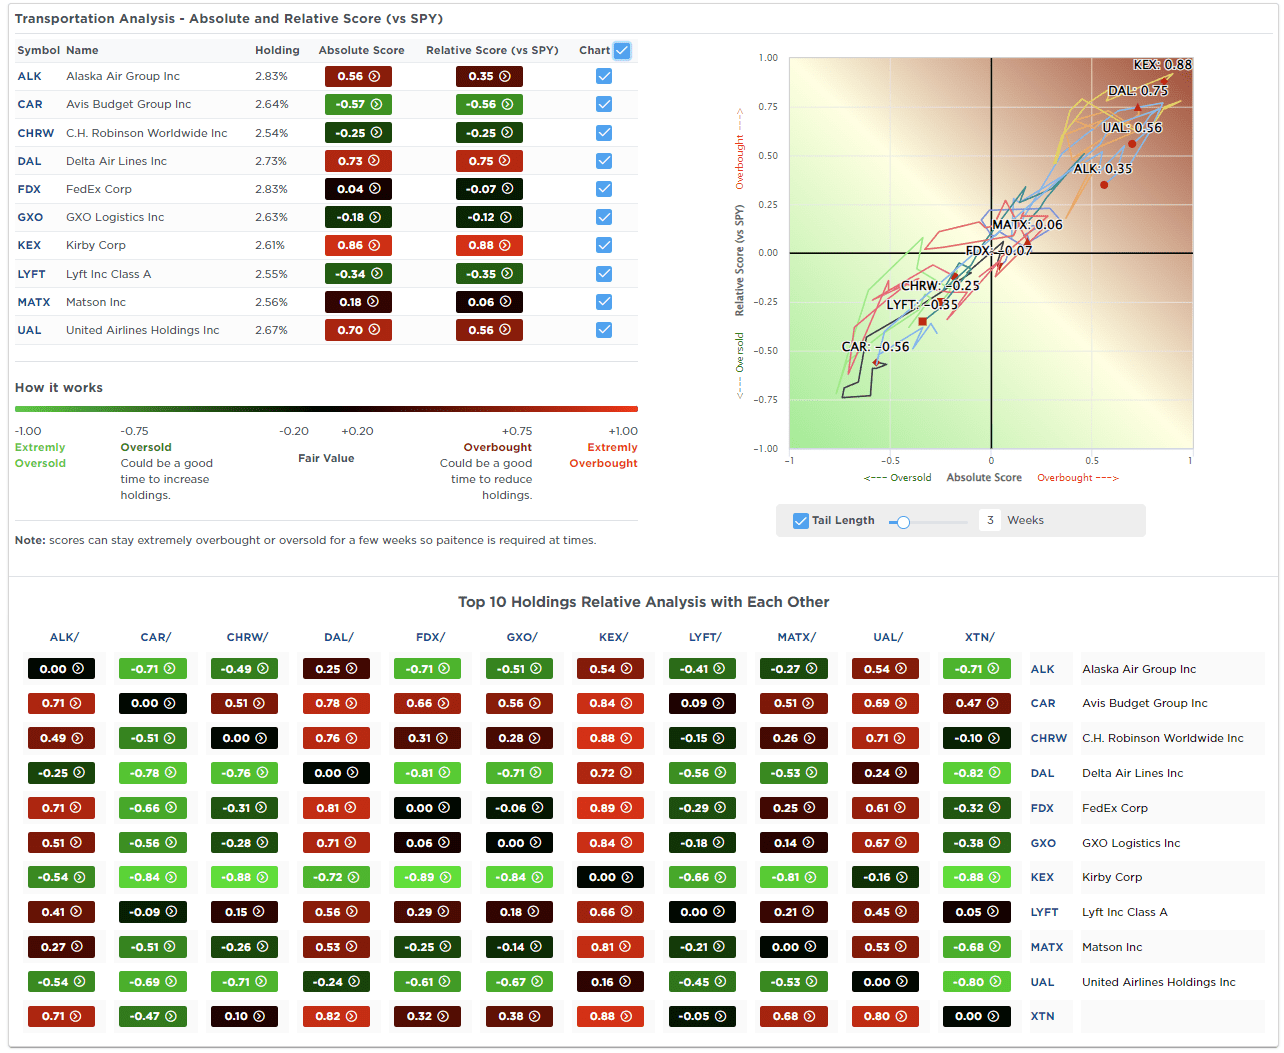
Most Oversold Sector Analysis
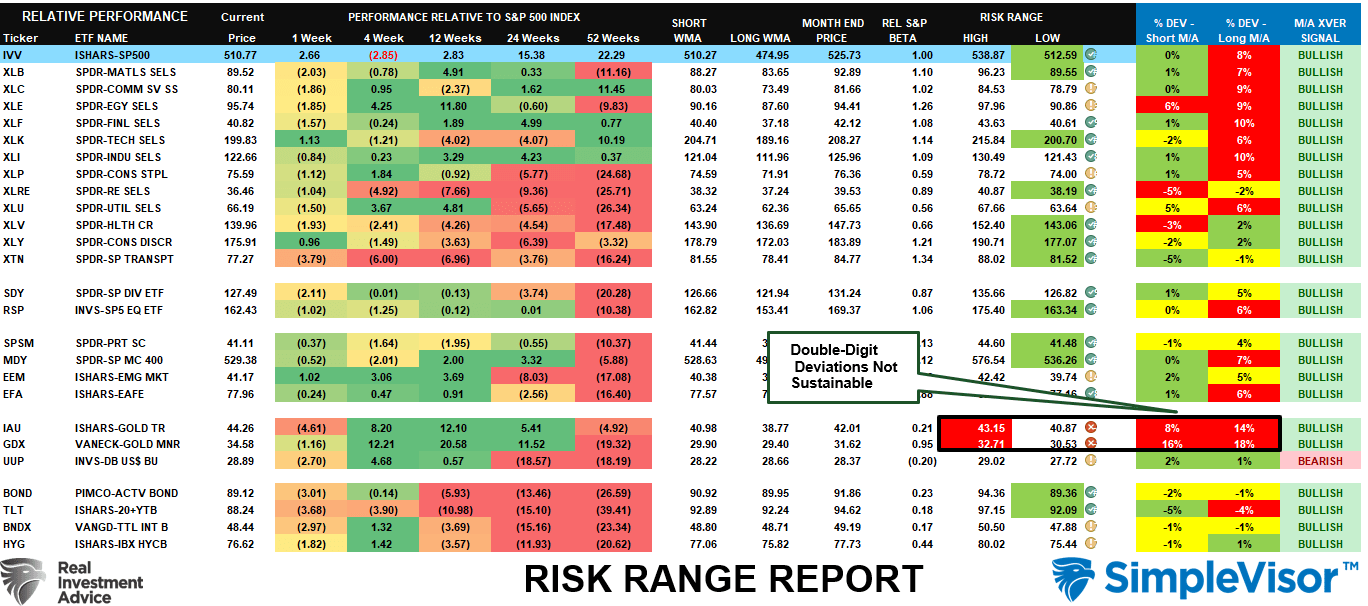
Sector Model Analysis & Risk Ranges
How To Read This Table
- The table compares the relative performance of each sector and market to the S&P 500 index.
- “MA XVER” (Moving Average Crossover) is determined by the short-term weekly moving average crossing positively or negatively with the long-term weekly moving average.
- The risk range is a function of the month-end closing price and the “beta” of the sector or market. (Ranges reset on the 1st of each month)
- The table shows the price deviation above and below the weekly moving averages.
As noted last week:
“While that correction is not yet likely complete, a majority of markets and sectors have reached levels that suggest a bounce.“
That bounce came last week, and there is potentially further upside in the near term, with many sectors still below their normal monthly ranges. Gold and Gold Miners remain significantly extended above normal ranges. Notably, many sectors and markets still have large deviations from longer-term means. Such suggests a more significant correction at some point to resolve that issue.
Weekly SimpleVisor Stock Screens
We provide three stock screens each week from SimpleVisor.
This week, we are searching for the Top 20:
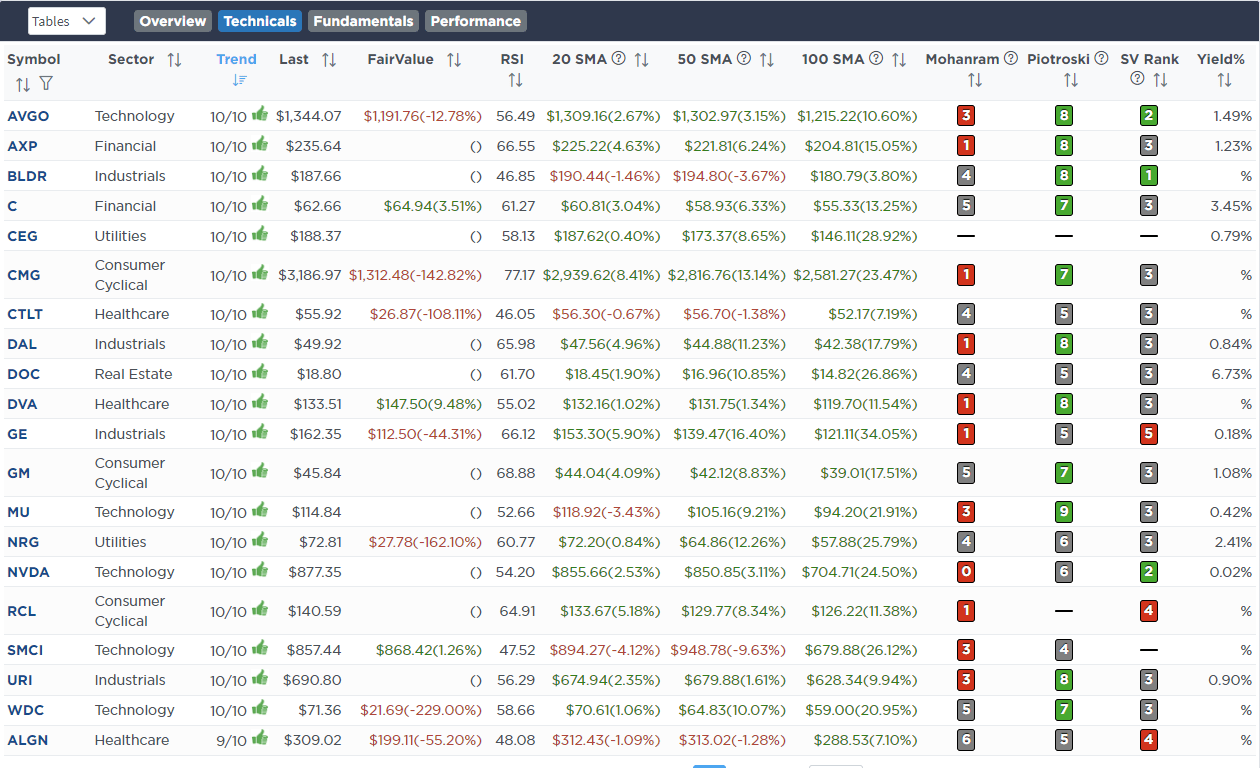
- Relative Strength Stocks
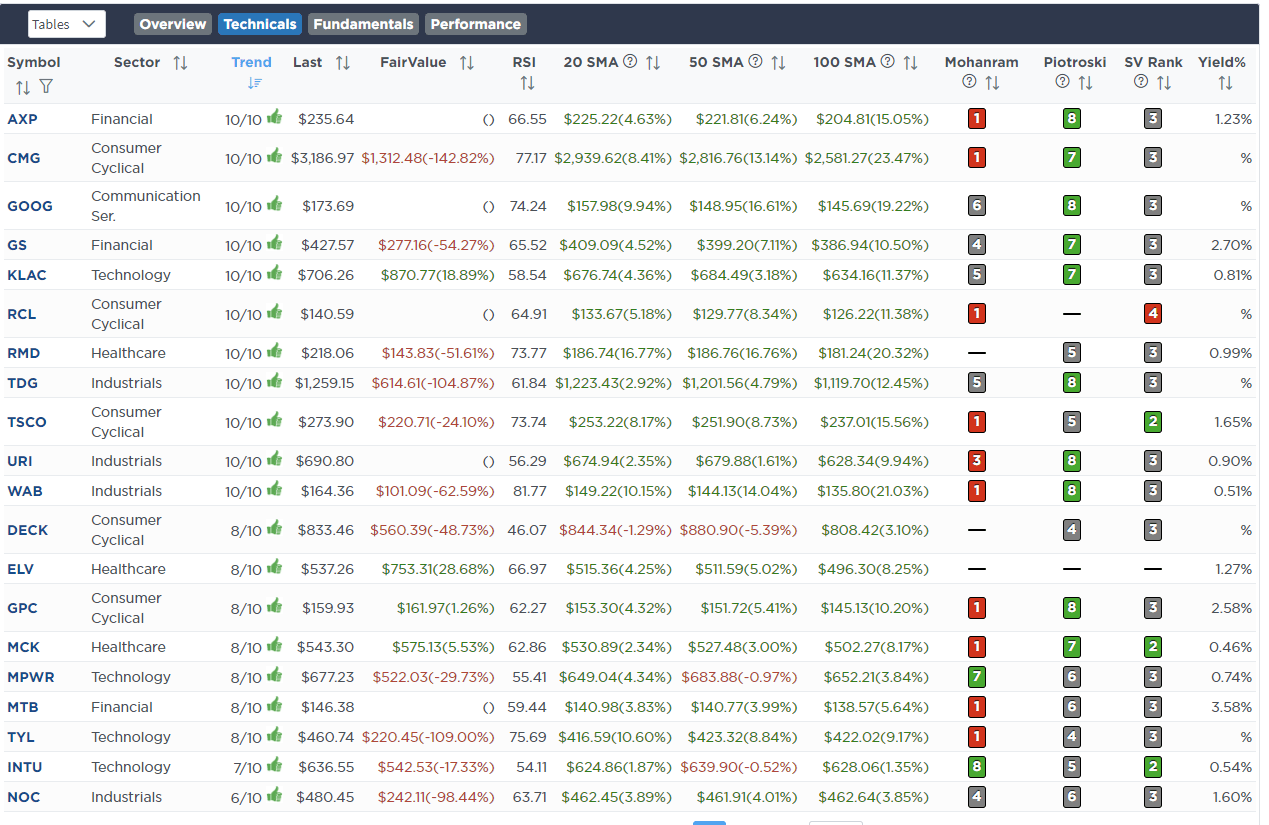
- Momentum Stocks
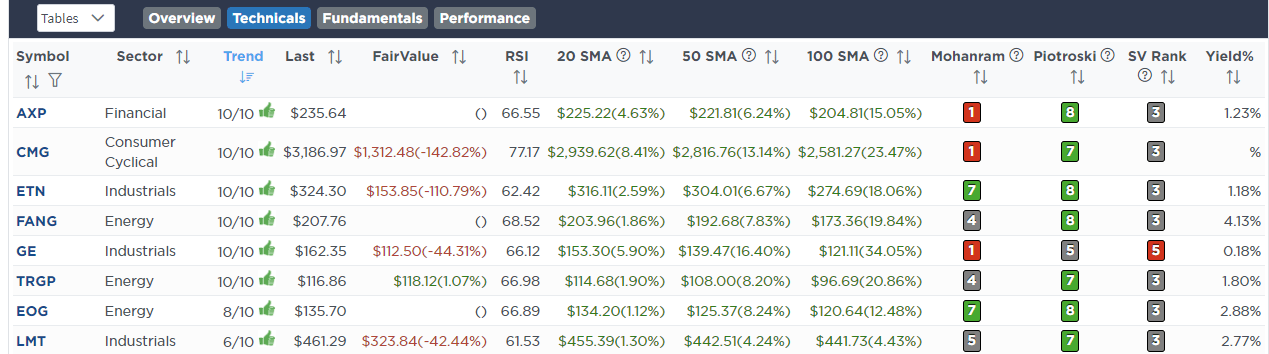
- Fundamental & Technical Strength W/ Dividends
(Click Images To Enlarge)
RSI Screen
Momentum Screen
Fundamental & Technical Screen
SimpleVisor Portfolio Changes
We post all of our portfolio changes as they occur at SimpleVisor:
April 26th
Trade Alert – All Models
“We are using the recent correction to rebalance some holdings in all models.
In the EQUITY model, we are selling 100% of Comcast (CMCSA), as we are overweight communications, for the tax loss after taking gains in both Nvidia (NVDA) and AMD (AMD) earlier this year. After the correction in Technology, we are bringing NVDA and AMD back to model weight. Given the market volatility, however, we are balancing those positions by increasing Berkshire (BRK.B), Costco (COST), and Walmart (WMT).
In the ETF model, we are reducing the Communications ETF (XLC) by 1% and increasing the Discretionary ETF (XLY) by an equal amount.
In the DIVIDED model, we have been waiting for a correction to continue moving that model toward target weightings following its launch earlier this year. As such, we are adding to Apple (AAPL), Medtronic (MDT), CVS (CVS), Verizon (VZ), Stanley Black & Decker (SWK), Realty Income (O), Fastenal (FAST), Microsoft (MSFT), Amazon (AMZN), and Nvidia (NVDA). Alerian MLP (AMLP), Meta (META).”
Equity Model
- Sell 100% of Comcast Communications (CMCSA) for the tax loss.
- Increase AMD (AMD), Nvidia (NVDA), Berkshire (BRK.B), Costco (COST) and Walmart (WMT).
ETF Model
- Sell 1% of SPDR Communications ETF (XLC)
- Buy 1% of the portfolio of SPDR Discretionary ETF (XLY)
Dividend Equity Model
- Increase holdings of Apple (AAPL), Amazon (AMZN), Nvidia (NVDA), Meta (META), Medtronic (MDT), CVS (CVS), Verizon (VZ), Stanley (SWK), Realty Income (O), and Fastnel (FAST), Alerian MLP (AMLP)

Lance Roberts, C.I.O.
Have a great week!


